Senior Frontend Architect, 10+ years building production Next.js applications. Contentful Certified Professional (2024). Specializes in React Server Components, headless commerce, and Core Web Vitals engineering.
The Core Web Vitals report is one of the few places where Google states a plain pass or fail on your site, which is exactly why a red 'Failed' produces more panic and more misdirected work than almost any other message in Search Console. The report is not a speed score and it is not an opinion about your code. It is an aggregate of what real Chrome users actually experienced on your pages over the last 28 days, compressed into three thresholds. Reading it properly takes about ten minutes and avoids the far more common outcome: a team that spends six weeks compressing images when the metric that failed was interaction latency. As of the HTTP Archive 2025 Web Almanac, 43% of mobile origins still fail INP, and INP is the one metric a lab test never shows you. This guide covers what the assessment measures, how to identify the failing metric and the page group behind it, why the status lags your fix by weeks, what the failure genuinely costs in rankings versus revenue, and where the line sits between a fix your own team can ship and one that needs engineering.
What does 'Core Web Vitals assessment: Failed' actually mean?
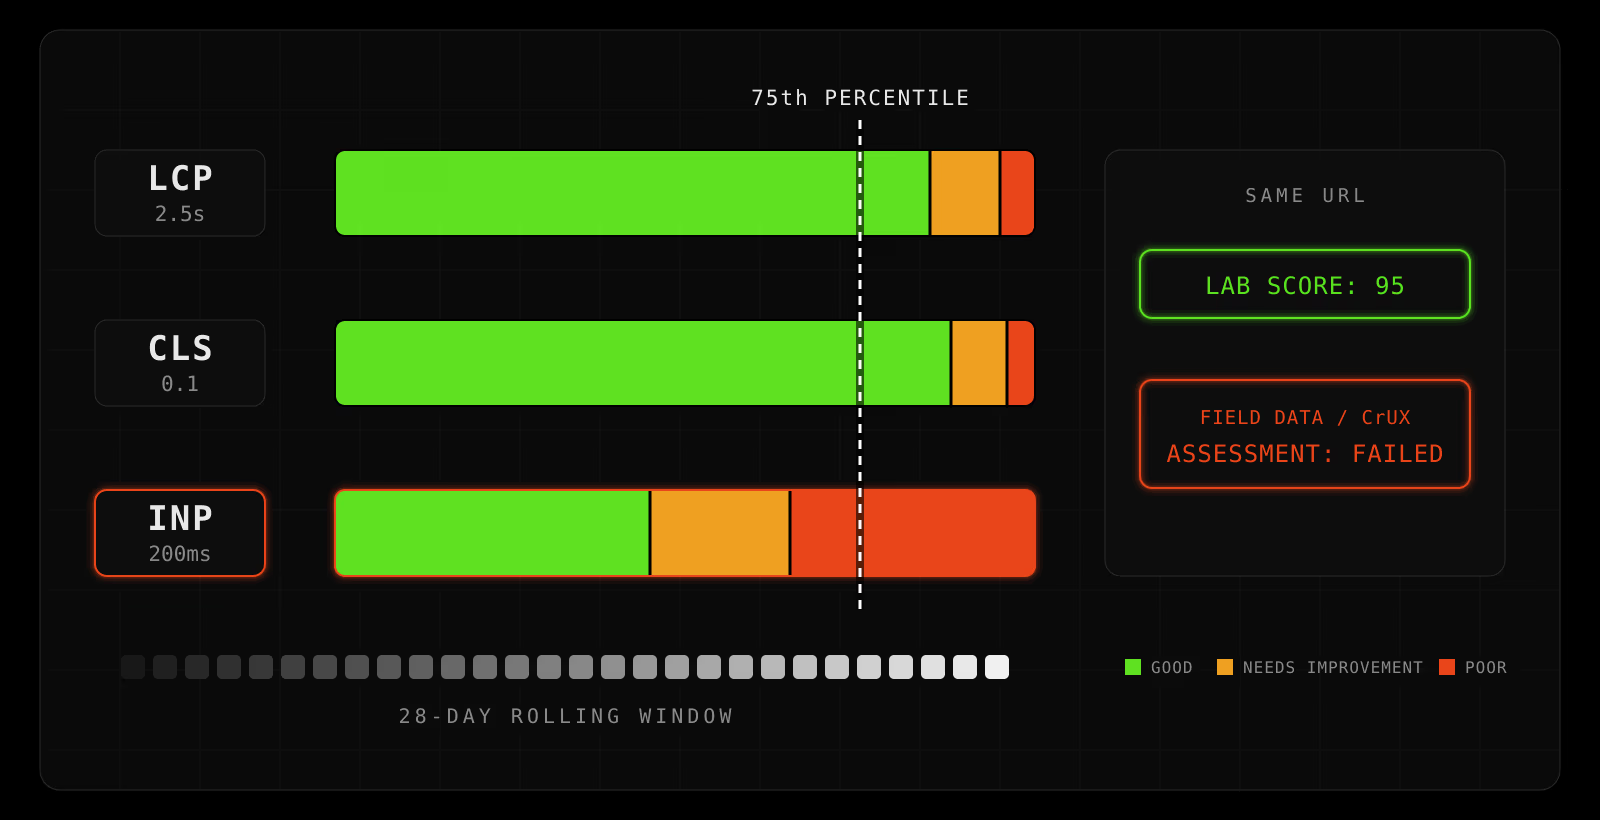
The assessment is a pass or fail verdict on a group of URLs, derived from the Chrome User Experience Report (CrUX). CrUX collects measurements from real Chrome users who opted into usage statistic reporting, on real devices and real networks. Search Console takes 28 days of that data, groups your URLs by structural similarity (in practice, by page template), and computes the 75th percentile of each Core Web Vital for each group. A group passes only if all three metrics land in the 'Good' band at that percentile. One metric outside the band fails the entire group, and mobile and desktop are assessed as independent data sets, so a site can pass on desktop and fail on mobile running identical code. The word 'Failed' therefore carries a narrow and precise meaning: at least one of three specific numbers, measured across at least a quarter of real visits, sat outside a threshold Google published in advance.
- LCP (Largest Contentful Paint): Good ≤ 2.5s, Needs improvement 2.5–4.0s, Poor > 4.0s. Measures when the largest visible element in the viewport finishes rendering, which is the closest technical match to a user's sense that the page has loaded.
- INP (Interaction to Next Paint): Good ≤ 200ms, Needs improvement 201–500ms, Poor > 500ms. Measures the latency of interactions across the whole session, reported at roughly the 98th percentile of one user's interactions. Replaced FID as a Core Web Vital on March 12, 2024.
- CLS (Cumulative Layout Shift): Good ≤ 0.1, Needs improvement 0.1–0.25, Poor > 0.25. Measures unexpected movement of visible content during the page's lifespan, scored as a unitless product of impact fraction and distance fraction.
- The 75th percentile rule: A metric counts as 'Good' for a URL group only when at least 75% of qualifying visits achieved a Good value. Optimizing for your own device on your own connection tells you nothing about the 25% tail that decides the verdict.
- Separate device verdicts: Mobile is where failures concentrate, because the CrUX sample is dominated by mid-range Android hardware rather than the laptop the site was tested on.
Why does PageSpeed Insights show 95 while Search Console says Failed?
Because PageSpeed Insights puts two unrelated measurements on one screen and most people read only the coloured circle. The top section, when it is present, is CrUX field data: the same 28-day real-user distribution Search Console grades. The large score underneath is Lighthouse, a single synthetic run on an emulated mid-tier device with throttled CPU and network, executed at that moment, with no human touching the page. The two disagree routinely and neither is wrong. The most important structural gap is INP: a lab run has no real interactions to time, so Lighthouse cannot produce an INP value at all and substitutes Total Blocking Time as a rough proxy. A page can score 100 in the lab and carry a 600ms INP in the field, and the lab score gives no warning whatsoever. One rule resolves almost every case of this confusion: the field data decides your assessment, the lab data only helps you debug it.
- Lab data (the Lighthouse score): One run, emulated mid-range device, simulated network throttling, no user interaction, no extensions, no cold-cache variance. Useful for reproducing a problem and for regression gates in CI. Never the basis of your assessment.
- Field data (CrUX): 28 days of real sessions across the actual distribution of devices, networks, geographies and browser extensions your visitors have. This is what Search Console grades and what Google's ranking systems consume.
- INP is field-only: Lighthouse reports Total Blocking Time instead. TBT correlates with INP but is measured during load, while INP is measured across the entire session, including the filter clicks and menu taps that happen long after load finishes.
- URL versus origin: PageSpeed Insights falls back to origin-level field data when a single URL has too few samples. You can be reading your homepage while the number on screen is the average of every page on the domain.
- The practical test: If the lab score is green and the assessment is red, open the field data block and read the three bars. In most cases INP or CLS is the culprit, and neither is visible in the headline number.
Which of the three metrics failed, and how do you check?
Search Console answers this directly, but the answer lives in the issue rows rather than in the headline chart. Open Core Web Vitals, choose Mobile or Desktop, and read the issue list underneath the graph. Each row is phrased as a metric, a threshold and a device, for example 'LCP issue: longer than 2.5s (mobile)', and each carries a count of affected URLs. Clicking a row reveals example URLs, and those examples are the more valuable output, because they show which page template is failing. Failures cluster by template rather than scattering randomly, so a single product listing layout or a single article layout usually accounts for the whole group. Confirm the diagnosis on one representative URL in PageSpeed Insights by reading the field data block rather than the score, and if the sample looks thin, the CrUX API returns the full histogram for any URL or origin.
- Start with the issue rows, not the chart: The chart shows how many URLs sit in each band. The rows name the metric and the threshold that produced the verdict.
- Use the example URLs as a template map: Group them by URL pattern. If every failing example is a
/collections/*or/blog/*path, you have one layout to fix rather than hundreds of pages. - Verify per URL in PageSpeed Insights: Read the 'Discover what your real users are experiencing' block. The score below it is a separate measurement and should not be used to confirm or deny the assessment.
- Pull the raw histogram when the sample is thin:
https://chromeuxreport.googleapis.com/v1/records:queryRecordaccepts a URL or an origin and returns the full distribution, including the p75 value Search Console used. - Instrument your own sessions: The official
web-vitalslibrary implements the same algorithms CrUX uses. ReportingonLCP,onINPandonCLSto your analytics gives you attribution CrUX cannot: which element, which route, which interaction.
If you want the three field values, the lab metrics and the on-page issues behind them in a single pass, the free site audit runs these checks on any URL and returns them together, including whether CrUX holds field data for your domain at all.
Search Console says Failed on mobile and Good on desktop. Which one do you act on?
Act on mobile first, and read the two as separate verdicts rather than a contradiction. Search Console applies the Poor, Needs improvement and Good labels to a URL group 'for that specific device type', so the mobile row and the desktop row are two independent statements about two different populations of visitors, and nothing is inconsistent about one passing while the other fails. The same page served to a mid-range Android phone on a mobile network and to a desktop machine on fibre genuinely produces different numbers, and mobile is where LCP and INP break first, because the phone has less CPU to spend on your JavaScript and a slower round trip to your origin. Mobile earns priority for a plainer reason than any published ranking weight, though. Open the Performance report, split it by device, and in most cases you will find that the majority of your sessions arrived on a phone, which makes the mobile verdict the description of what most of your visitors actually got.
- One bad metric fails the whole device group: A group takes 'the slowest status assigned to it for that device type', so a single Poor metric on mobile marks the entire mobile group Poor while the other two sit comfortably in green. Read the issue rows before concluding the page is broadly slow.
- Prioritize from your own device split, not from a rule of thumb: The Performance report's device filter shows how your traffic actually divides. A B2B tool with 70% desktop sessions and a failing desktop group has a different first task than a consumer store with 85% mobile.
- A desktop pass never validates a mobile fix: Verify on the device type that failed. Checking the fix on the machine you built it on reproduces the exact conditions that hid the problem in the first place.
- Desktop-only failures usually have a different cause: When mobile passes and desktop fails, look for what grows on a wide viewport: a full-width hero at desktop resolution, a carousel that only renders above a breakpoint, a widget the mobile layout hides entirely. Testing narrow viewports out of mobile-first habit skips all of it.
Why is a URL you measured as fast sitting inside a failing group?
Because the verdict belongs to a group of similar pages rather than to the URL you tested. Search Console groups URLs 'into pages that have a similar user experience', on the stated assumption that pages sharing a framework will fail for the same underlying reason, and it then publishes one status for the whole group. Your product page can be genuinely fast while its group is Poor, because the group's 75th percentile is drawn from visits to every URL inside it, including the pages nobody thinks to test: the variant carrying forty images, the category that returns two thousand rows, the old campaign landing page still loading a widget you forgot about. When there is too little data to describe a group at all, the report consolidates what it has to the origin level, which is why some sites see one verdict for an entire domain and can never trace it to a page.
- Treat a failing group as a failing template: The fix belongs in the layout the group shares, not in the individual URL you happened to open. One template fix moves every URL in the group at once.
- Hunt the worst URL, not a representative one: The example URLs in an issue row are examples rather than a complete list. Sort your own analytics by the heaviest pages inside the failing pattern and measure those, because they are what pushed the percentile over the line.
- Origin-level data cannot be debugged per URL: Once the report has consolidated you to the origin, no amount of testing individual pages will isolate the cause. Instrumenting your own routes with
web-vitalsgives you the per-template attribution CrUX is withholding. - A group can vanish instead of passing: A URL group without threshold data for the metrics will not appear on the report at all, so a group leaving the report is not proof of a fix. Traffic falling below the sampling threshold looks identical from the outside to a success.
Why does the report still say Failed weeks after you fixed the problem?
Because the assessment is computed over a trailing 28-day window, and a deployment does not retroactively change the sessions already inside it. On the day you ship a fix, the window still holds 28 days of pre-fix visits. Each following day retires one day of old data and adds one day of new, so the 75th percentile improves gradually and only reaches its true post-fix value about four weeks later. Search Console then adds its own processing delay of a few days. This lag is the most expensive misunderstanding in the whole report, because the natural reading of an unchanged red status is that the fix did not work, which sends teams back to change more code and destroys any ability to attribute the result. The correct response to a red status two weeks after a deploy is to verify the fix in fresh data, not to fix again.
- Expect roughly four weeks to full effect: Partial movement appears within days as old sessions age out, but the final number is not trustworthy until the window has turned over completely.
- Search Console lags CrUX: The report reflects data that is already several days old. A same-week check tells you nothing at all.
- Starting validation changes nothing about the timing: The Start tracking button in this report restarts a four-week monitoring period over CrUX data rather than requesting anything from Google, so it is useful as a dated record of when you claimed the fix and useless as an accelerator.
- Watch your own RUM in the meantime: Field instrumentation via
web-vitalsshows the effect of a deploy within hours, on your own traffic, with no 28-day smoothing. It is the only fast feedback loop available. - Do not stack fixes blindly: Shipping three more changes during the validation window makes it impossible to know which one moved the number, or which one caused a regression.
Does starting validation in Search Console make Google re-check your fix faster?
No. Find the control first, because it is not named what most people search for: in this report it reads Start tracking, while the Validate fix wording belongs to other Search Console reports. Google then states outright what pressing it does. It 'does not trigger re-indexing or any other active behavior from Google. It just (re)starts the clock on a 4-week monitoring period of CrUX data.' There is no crawl to request and no queue to join, because the assessment was never built from a crawl. It is built from measurements Chrome collects from real visitors, and those arrive at their own pace whether you press anything or not. The button's only genuine function is bookkeeping, and pressing it too early is the mistake worth avoiding: a tracking period opened before the fix is actually live spends its four weeks measuring the broken version and comes back Failed, which then reads as evidence that the fix did not work.
- Press it after the deploy, not around it: Confirm the fix in your own field instrumentation first, then start tracking. The window then contains only post-fix sessions, which is the only way the result means anything.
- Failed does not mean your fix failed: It means at least one URL was still affected during the window. The documented response is to fix the remaining URLs and start a new tracking period, not to redo work you already verified.
- You do not need the button at all: An issue can come back marked N/A, which is Google's label for a problem it detected as fixed without any validation request. The assessment turns green on the strength of the field data alone.
- 'Looking good' is not a pass: That state reports only that the URLs checked so far are clean while the window is still open. The status worth waiting for is Passed.
Does a failed Core Web Vitals assessment actually hurt your Google rankings?
Less than most articles on this subject imply, and it is worth being precise, because the exaggeration leads to bad budget decisions. Page experience, of which Core Web Vitals is the measurable part, is a genuine input to Google's ranking systems, but it works as a differentiator between results of comparable relevance rather than as a primary factor. A fast page with thin content does not outrank a slower page that answers the query properly. If your pages are not ranking, Core Web Vitals is rarely the reason, and a performance project will not repair a content or authority problem. Where the failure does cost you reliably is after the click: slow and unstable pages shed users at every step of a funnel, and that loss is entirely independent of where you rank. The honest framing is that Core Web Vitals is a conversion and retention concern with a modest ranking bonus attached, and it should be funded on the first justification rather than the second.
- A tiebreaker, not a lever: Google's own guidance positions page experience as helpful when other signals are comparable. Treat a ranking gain as a possible side effect, not as the business case.
- The revenue case is stronger than the ranking case: Abandonment rises with load time and with instability regardless of search position. The effect applies to paid, email and direct traffic too, none of which care about your ranking.
- Failures concentrate where intent is highest: INP problems typically surface on filters, site search, variant pickers and cart interactions, which is precisely where a visitor has already decided to buy.
- Diagnose before funding: If organic traffic is flat and rankings are poor, audit content, internal linking and indexation first. Core Web Vitals work on a site with no relevant content is expensive decoration.
- Related reading: For the ranking-side signals that usually matter more, see the JSON-LD schema guide, and for the full performance picture the web performance guide.
What if Search Console shows no Core Web Vitals data at all?
That is a sample size problem rather than a penalty, and it is the normal state for a large share of sites. CrUX only reports a URL or an origin once it has collected enough qualifying visits from opted-in Chrome users to produce a statistically meaningful distribution without exposing individual browsing behaviour. Smaller sites frequently see no URL-level data, origin-level data only, or data that appears and disappears as traffic fluctuates. None of this affects your ranking, and no amount of optimization makes the data arrive faster, because the constraint is traffic volume rather than page quality. The practical consequence is that Search Console cannot be your feedback loop, so you have to build your own.
- Check what exists first: Query the CrUX API for both the URL and the origin. Origin-level data often exists when URL-level data does not, and it is still a legitimate signal about your templates.
- Instrument real users yourself:
npm install web-vitals, then reportonLCP,onINPandonCLSto your analytics. Even a few hundred sessions a week yields a usable 75th percentile long before CrUX would. - Use lab data honestly: Lighthouse on a throttled mid-range profile is a reasonable proxy for LCP and CLS. It is not a proxy for INP, so test the real interactions by hand on an actual mid-range Android device.
- Do not chase a green lab score: With no field data the lab number is the only feedback available, which makes it tempting to optimize for it directly. That path ends in a perfect score and a site that still feels slow in the hand.
Which failures can you fix yourself, and which need an engineer?
The dividing line is whether the fix changes a setting and an asset, or changes how the page is constructed. Most CLS failures and a meaningful share of LCP failures sit on the first side and are genuinely fixable by a competent marketing or store team in an afternoon: an oversized hero image, a missing width and height on an embed, a banner injected above the fold after load, a font that blocks rendering. INP failures almost never sit there. Interaction latency is a property of how much JavaScript runs on the main thread and when, which puts the fix inside the component architecture, the hydration strategy and the third-party script budget, none of which are reachable from a settings panel. The useful question before committing budget is not 'how bad is the score' but 'which of these two categories is my failure in', because the answer changes the cost by an order of magnitude.
- Your team can usually fix: Uncompressed or oversized hero images; missing
widthandheightattributes on images, iframes and ad slots; late-injected cookie banners and promo bars; afont-displaysetting that blocks first paint; unused apps, pixels and tag manager containers; hosting with no CDN in front of it. - Needs engineering: INP driven by hydration cost or bundle size; an LCP element that is client-rendered and therefore cannot begin loading until JavaScript executes; render-blocking third-party scripts that cannot simply be deleted for business reasons; layout shifts originating in the component tree rather than in one asset; template rewrites where the page structure itself is the problem.
- The diagnostic shortcut: If the failing metric is CLS, start with your own team. If it is INP, start with an engineer. If it is LCP, look at what the largest element actually is: an image is usually yours, a client-rendered block usually is not.
- Related service: For an architectural review of the rendering and interaction path behind a failing assessment, see Core Web Vitals & Performance Engineering. The engineering detail behind INP specifically is in the INP optimization playbook.
What order should you fix Core Web Vitals issues in?
Order by determinism rather than by severity. CLS fixes are close to deterministic: reserving space for an element removes the shift it caused, and the effect is visible immediately in the lab and reliably in the field. LCP fixes are mostly predictable, since the largest element is identifiable and the work is compression, priority and delivery. INP fixes are the least predictable and the most invasive, because the same interaction latency can arrive from four different sources and the remedy is architectural. Working in that order banks confirmed improvements early, keeps the number of concurrent changes small enough to attribute, and means you arrive at the expensive architectural work with the cheap wins already removed from the measurement.
- 1. Confirm the target. Name the failing metric, the device and the template before touching code. A fix aimed at the wrong metric produces a green lab score and an unchanged assessment.
- 2. Fix CLS. Reserve dimensions on every image, iframe, embed and ad slot. Move injected banners out of the layout flow, or render them server-side with the space already allocated. Load fonts with a metric-matched fallback so the swap does not reflow text.
- 3. Fix LCP. Identify the LCP element in DevTools, then make it discoverable in the initial HTML, correctly sized, served in a modern format and prioritized. If it is client-rendered, moving it into the server-rendered payload usually beats any amount of asset optimization.
- 4. Fix INP. Reduce and defer main-thread JavaScript, break long tasks at interaction boundaries, isolate third-party scripts and narrow the hydration surface. This is the architectural work and it belongs last, once the measurement is no longer polluted by the first three steps.
- 5. Measure in the field, then wait. Confirm the change in your own RUM within days, then let the 28-day window turn over before reading the assessment as a verdict.
How long does it take for the assessment to turn green?
Four to six weeks from the deploy that actually fixes the failing metric, assuming the fix is correct and nothing regresses behind it. The floor is set by the 28-day CrUX window, which cannot be shortened, plus Search Console's own processing delay of a few days. In practice the timeline stretches when the first fix targets the wrong metric, which is common, or when a change improves the median without moving the 75th percentile, which is the specific trap of testing on good hardware over a fast connection. Sites with thin CrUX coverage may also flip between states for a while as the sample size wobbles. Plan the work as one deploy followed by a month of waiting rather than a month of iterating, and use your own field instrumentation for the feedback you need in between.
Conclusion
A failed Core Web Vitals assessment is a narrow, well-defined statement: over the last 28 days, at least one of three numbers sat outside its threshold for more than a quarter of real visits on a group of your pages. Almost all the wasted effort around it traces back to three misreadings: trusting the lab score over the field data, treating the 28-day lag as evidence that a fix failed, and assuming the ranking impact is larger than it is. Read the issue rows to name the metric and the template, decide whether the failure is an asset problem or an architecture problem, fix in order of determinism, then wait the window out instead of iterating inside it. Handled that way the work is a few focused days plus a month of patience, rather than the six-week image compression project that leaves the actual failing metric untouched.
Check your own numbers: the free site audit returns your field data, lab metrics and the on-page issues behind them for any URL, with no signup. If the failure turns out to be architectural, the Core Web Vitals & Performance Engineering service covers the rendering and interaction work, and you can book a call to talk through what your report is actually showing.
References
- Google web.dev - Core Web Vitals
- Google Search Console Help - Core Web Vitals report
- Google web.dev - Largest Contentful Paint (LCP)
- Google web.dev - Interaction to Next Paint (INP)
- Google web.dev - Cumulative Layout Shift (CLS)
- Chrome UX Report - API documentation
- Google web.dev - Lab and field data differences
- HTTP Archive - 2025 Web Almanac, Performance Chapter
- Google Search Central - Understanding page experience
- web-vitals library on GitHub